Sunday, November 29, 2009

Ballhype, Golden Picks and EV, Part 4: Devising and applying a method to determine probability with Sagarin Predictor Ratings

The Sagarin ratings have to also correlate to a team's probability to win, I thought. A team with a slightly higher rating than another team probably wasn't as strong a favorite as a team whose rating was 15-20 points ahead of their opponent.

I went to Google and searched for data on Sagarin and Probability. Many articles had a narrow focus, whether on their respective team or on yet another failed (and poorly researched) attempt to beat the sportsbooks with the data without any preliminary research. My previous observations showed that the final scores in any sport deviated so greatly from the point differential in Sagarin ratings that using them to determine a margin of victory was practically pointless as they were... though they still remained an accurate determinant of which team would win.

I landed on some data relating to Sagarin's ELO Chess number (which simply judges team resume strength by who they won and loss to with no regard to final scores)... that illustrated how you can use a chess player's rating in a 1500 point system to determine the probability of one player beating the other. The article by Brian Burke illustrates how a chess rating is determined on a match to match basis, and the workings of the algorithm that determines win probability for each player before a given match. The formulas may make your head explode unless you've seen Trig, Intermediate Algebra or Calculus level math before.


The rating formula, however, does a fine job of weighing the quality of a victory and using outcomes to determine a player or team's actual strength from their track record. And the probability formula provides an accurate correlative probability for each player's chances of victory.

Burke wrote that article in the context of evaluating the Sagarin rating system, and since Sagarin himself based the method off of the chess rating system, it would stand to reason that his ratings could in turn be used similarly to determine a team's probability of winning. Of course, using the formulas directly would not work since ELO Chess uses a 1500 point rating scale, and Sagarin's rating scale (where most ratings are around the 50-100 point mark) is distinctively different.

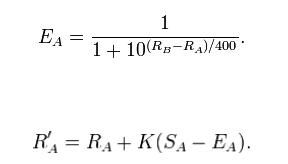
A similar rendition of the probability equation is shown here on the Pro Football Reference blog, where instead of the static factors of 10 and 400, factors of e (2.718281828...) and a different equation utilizing the control factor of -0.15:

Win Probability = 1 / (1 + e^(-.15*(rating difference)))

This formula always returns a value between 0 and 1, which can be translated into a percentage chance of victory.

Armed with OpenOffice Spreadsheet Power, I opened up a spreadsheet and tinkered my way to a template on which I could enter two competing teams' Sagarin ratings (with the requisite rating adjustment for the home team) and have a function spit out the home team's chance for victory:

=1/(1+(e^(-0.15*((home team's rating + home team bonus)-road team's rating))))

Convoluted? Basically, the difference between the home team (with their bonus) and the road team is multiplied by -0.15. Then the factor e (2.718281828...) is taken to the power of whatever number the first equation adds up to. That answer is added to 1, and then 1 divided by the answer to the last equation is the home team's chance of winning.

Because I enjoy crunching all this by hand as much as you do, I opened up an OpenOffice spreadsheet and plugged the formula into a simplistic interface that would allow me to just plug in Sagarin Predictor ratings (which Sagarin vouches is the most effective of his three given ratings in predicting outcomes, as they factor in final scores) and get a quick probability for the home team.

With no other specific data out there to verify or deny using the formula this way with Sagarin ratings, I plugged in a few Sagarin ratings for upcoming matchups, and the results I got were fairly consistent. To wit, top 25 teams often sported 95-98% chances of beating small college scrubs. If there's any data out there that provides a more accurate method for matching Sagarin ratings to probability, I have yet to find it.


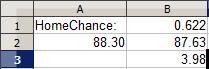
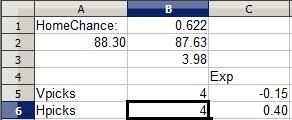
Cell B3 contains the home team bonus (which varies by sport). Cell A2 holds the visiting team's rating and B2 the home team's. I plugged the formula in at cell B1, which spits out a probability for the home team.

Above are ratings for two teams whose identities I have since forgotten (though from the 3.98 home bonus I recognize the teams are from NCAA College Basketball). The road team's 88.30 rating and home team's 87.63 rating with 3.98 bonus indicates that the home team has a 62.2% chance of winning their game, which makes sense: In a basketball matchup between two roughly equal teams (which these two are), the home team tends to win 60-65% of the time.

(One aside: A common misinformed complaint about Sagarin's Predictor rating is that a huge blowout can artifically inflate a team's rating. However, the rating process actually follows a law of diminishing returns: For example, in determining the Predictor rating, a 35-0 victory adds more to a team's rating than a 14-10 victory... but a 70-0 victory doesn't add all that much more than a 35-0 victory. Both blowouts add roughly the same amount in rating strength.

Likewise, in determining win probability... the greater the difference in ratings, the greater the probability the favorite will win... but as the difference increases in size, the amount of winning probability added to the favorite's chances reduces in scope. The PFR article includes a helpful graph to illustrate:


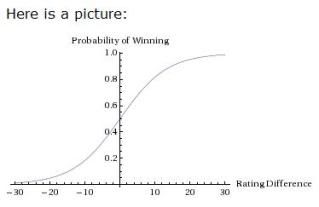
Much like a bell curve, the chances of winning change dramatically as the difference between teams goes up from 0... but as the difference reaches a high margin, the chances of the favorite winning flatten out around the 95-98% mark, which makes sense since, after all, you can't go past 100% and if any team really had a 100% chance of winning, there'd never be any Appalachian State over Michigan level upsets and there'd be no point in playing the game.

Now... going back to Ballhype's Golden Picks Contest, the value of a pick is directly proportional to how many other people have picked each particular team to win. The more people that pick one team, the fewer points each person gets when the favorite wins, which diminishes the value of picking the favorite as each additional person selects that favorite to win.

Lisewise, the more people that pick a favorite, the more value there is in picking the underdog, as you'll then get more points if the underdog wins. At the same time, the more people that pick the underdog, the less value you get in picking the underdog, as each additional person dilutes the split each person gets for a successful underdog pick... and in turn, the more value that subsequently comes in picking the favorite, since those who pick the winning team get an additional point for each person that selects an unsuccessful underdog.

Amidst all this, there is one constant: Every incorrect pick is always worth -1 point, regardless of whether your incorrect pick was a favorite or underdog. That's where the Hensley Strategy succeeds: There is a stop-loss limit of -1 point for every wrong pick, but no ceiling on the point value of successful underdog picks. With every additional person picking the favorite, you get an additional point if you're picking the underdog and the upset happens. With a shallow ceiling for failure and a ceilingless potential with success, picking underdogs typically carries a positive EV.

The thing is, picking an underdog does not always produce a positive EV. There is a point where a favorite is such a huge favorite that a large number of people would need to pick the favorite for an underdog pick to have a positive EV.

The point of all this is that I expanded my meager spreadsheet with a pair of separate EV functions that factored in the calculated probabilities of each team, the number of picks for each team on the contest, and the expected value of each respective pick:


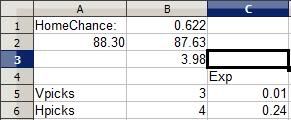
In Cell B5 I enter the number of current picks in the contest for the visitor and picks for the home team in Cell B6. Column C6 determines the EV of picking the home team with the following formula:

=(Home team probability *(Number of total points for correct pick divided by number of players making this pick)+((Road team's win probability)*(-1 point for losing)))

Basically, I take the probability of a win times the possible points I can earn for winning, then add together the probability of losing (the other team winning) times -1 point. The formula is flipped over for the road team, and the expected value of each respective pick is listed under "Exp" for both picks. Currently, the 3 people who picked the road team have an expected value of 0.01 point... barely above zero and just a shred more valuable than not having made the pick at all. The 4 people who selected the home team have an EV of 0.24 point, meaning the pick has a positive expected value, a smart pick....

... for now. See, other people may make a pick between now and game time, and every pick can affect the expected value of a pick, even though the probabilities aren't going to change, since every pick affects the potential point distribution for the winner.

Let's see what happens when I decide to pick the road team.


The EV for picking the road team immediately drops to -0.15 points, making it a bad pick in the same sense that playing craps is a negative EV decision. In craps, the odds make it so that the House will take your money in the long run. If I were put in this same situation an infinite number of times and made this exact same pick, I would lose an average of 0.15 points for each time I made the pick. It's a losing pick: The points I win every time the road team succeeds are not worth as much as the point I lose every time the home team wins. Sure, the road team may win and it's all moot, but the combination of the odds and the potential value show that this is a bad pick.

Now, let's see what happens when I flip flop and pick the home team instead.


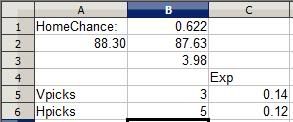
The value of picking the home team also decreases (a pick's EV is always going to decrease when you make it because you're diluting the payout by adding a person to divide it with). But in declining, the EV of the selection remains positive. If placed in this situation an infinite number of times, I would gain an average of 0.12 points for each time I picked: The value of a win here is going to be worth more than all the times I lose a point when the pick fails.

Thus, it's clear in this instance that I ought to pick the home team to win. Sure, in this case I'm picking the favorite, but it's not always worthwhile to pick the favorite. Here's an example where picking an underdog may be a good decision:


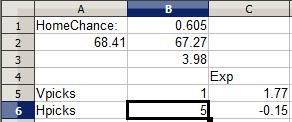
This college basketball matchup I remember: Pepperdine traveled to Wyoming for a non-conference game. Both teams are fairly so-so but roughly equal, making the home team Wyoming a 60.5% favorite. However, as you can see five other players had already selected Wyoming while only one had selected Pepperdine, making the Wyoming selection a negative EV pick for everyone involved while the Pepperdine pick was an overwhelmingly positive EV pick. So I went ahead and picked the underdog Pepperdine:


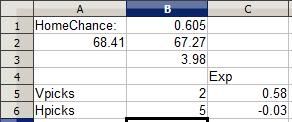
As you can see, the reduced EV was still overwhelmingly positive, making the Pepperdine pick a more profitable pick. Even if Pepperdine goes on to lose as predicted, the value the Wyoming selectors got from their pick was negative. Results based analysis would say they're right, but probability analysis shows that making that pick 1000 times would be a loser in the long run. A somewhat-unlikely Pepperdine upset would yield more value for Pepperdine selectors than a likely Wyoming win would net for Wyoming selectors.

Now, this doesn't necessarily mean picking a favorite in Ballhype is a bad value, or that picking a big underdog is necessarily a good value. Sometimes a team is such a large favorite that even if their win would net a selector a very small score and that an upset would net an underdog pick a huge score... the odds are so great that the favorite will win that picking the underdog is pointless.


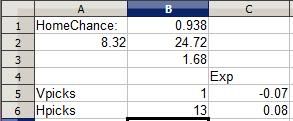
This is from this week's NFL matchup between the Cleveland Browns and Cincinnati Bengals in Cincinnati. The Browns' rating is clearly horrid in comparison to Cincinnati's and the Bengals are a huge 93.8% favorite. Even with a whopping 13 other selectors diluting the Bengals pick, the Bengals remain a positive (albeit small) EV pick while the Browns remain a negative pick, simply because the odds of the talented Bengals defeating the woeful Browns is so great. I add my pick to the fray:


Notice how the EV remains positive for the Bengals pick. A Bengals win nets 0.14 point, but the chance of earning that point is so great and the chances of a crushing -1 point upset are so small that the Bengals pick is still a smart one, while picking the Browns is foolish despite the 14 point potential, akin to putting your money on a couple of roulette numbers (a more than 35 to 1 shot for each number) and hoping one happens to hit. (The Bengals did go on to win this early game 16-7)

It is with this methodology that I went to work on picking Friday's games... to be covered in Part 5.

Saturday, November 28, 2009

Ballhype, Golden Picks and EV, Part 3: The Sagarin Rating System and Finding a Better Use for It With EV

Your mileage may vary on the validity of the Sagarin ratings, but history shows a sustained accuracy in determining straight up winners across sports and levels. Even given the volatility of Sagarin's early season ratings, which carry over last year's performance until the current season adds enough data to stand on its own, not taking fully into account the current team's relative competitiveness... the ratings are to a great degree accurate, from 65-70%.

- Against the spread is another story, and to a system all systems seem to only have a consistent 47-55% accuracy against the spread, but that's another issue for down the road.

- While there are a variety of other predictive systems, I go with Sagarin given its longer history of accuracy (dating back to 1985), and because Sagarin covers all major sports compared to other systems focusing on certain sports. The methodology has a consistent accuracy across the board in all sports, college or pro.

As many others certainly do, I started out in the Ballhype contest using Sagarin's ratings as a guide. The only problem, of course, is that you typically end up picking the favorites, which comes with little reward since so many others are picking the favorites as well. You receive a small fraction of a point when you win, and lose the full one point when you lose. A single loss can undo several wins in an instant. However, when the underdog scores the upset, the Hensleys of the world pick up massive points and blow by everyone at once, even after missing on several other underdog picks where the favorite won.

Eventually, I started taking the Hensley route and picking all the underdogs in the pro games, as that's where a regular number of upsets occur. Even the worst pro teams often manage to win 30-40% of their games, and the best teams can lose 20-40% of theirs. Simple logic would indicate that scoring 5-10 points around 20-40% of the time and losing only one point 60-80% of the time will still lead to a big net gain.

At the same time, I noticed that many of the dozens of college games in football and basketball were such lopsided contests that picking the underdog still didn't make sense, such as the Florida football team against, say, Chattanooga. Even Hensley himself avoided picking an underdog in some contests. Many college games had 9-11 picks for the favorite and 0 for the underdog, and that favorite rolled to victory, a meager but assured 0.09 points for everyone.

Seeing that dual phenomenon, I felt there was a way to improve on Hensley's underdogs-only method, a middle ground where you could pick a favorite and have a good chance to win, while knowing when to pick an underdog. Every now and then Sagarin ratings would indicate an underdog was the most likely team to win but these instances weren't frequent.

However, some comparisons were closer than others. Some Sagarin comparisons showed lopsided differences between teams, while some leaned one way but were very close. Obviously, not all picks were equal, and I recalled my poker research and discussions of expected value. Knowing the relationship between probability and expected value, I realized that there had to be a direct correlation between the marginal difference in Sagarin ratings between two teams and the probability of each team winning. Putting that correlation and the idea of expected value together, I decided there had to be a way to devise a system that would maximize the return on each Ballhype Golden Picks selection.

"Why do this?", you ask. "Who cares? It's just a game." Yes it is. And so is, say, sportsbook wagering. The difference is that the latter nets you money when you win. Knowing that poker players utilize odds and expected value concepts to play poker profitably over the long run, I realize that EV concepts could cross apply to selecting teams provided systems of rating teams that showed a consistent correlation in picking winners. While point spreads provide an additional challenge over Ballhype in picking winners, I figured I could cross that bridge if/when I confirmed that such systems worked in the confines of the Ballhype contest, which operates on a similar scope with straight up picks.

The big obstacle was determining a consistent method for devising a team's probability to win. That was the next step in my research....

[Continued in Part 4]

Ballhype, Golden Picks and EV, Part 2: Explaining Expected Value to the Uninitiated through a poker example

A few days ago, I recalled my poker research and the common theme of expected value (EV). Similar to the microeconomic concept of marginal utility, EV focuses around taking the expected gain of a positive outcome and multiplying by its probability of occuring... then subtracting the expected loss of a negative outcome multiplied by its probability of happening... to get a net expected value. If the final EV is negative, taking that route will fail in the long run, while the play will succeed in the long run if the net EV is positive.

To better illustrate the EV concept, here's a simplified example: Let's say you're playing $4/$8 limit Texas Hold'Em poker, and you have two pair on the turn, having paired your Ace and your Ten, with one card yet to come. There's $46 in the pot, one other player in the pot and he has made a single big bet of $8. You can close the action with a call, close the hand with a fold or keep the turn going with a raise to $16.

Let's say there's three of one suit on the board, neither of which match your cards, and whether or not you are a master reader, you know the guy making this bet well enough that you're fairly sure he has a flush (let's say the three cards are far enough apart that a straight flush is impossible), so to win this hand the river card has to improve your two pair to a full house (the only hand that will beat the flush). Therefore let's say the only options you will consider here are calling the $8 bet or folding. Is calling the $8 bet profitable?

With four cards on the board, and two in your hand, there are 46 other possible cards to come on the river. We need to find the probability that our needed full house card will come on the river. Let's never mind the cards other players have folded, cards that were burned between each street and cards in your opponent's hand, as the forthcoming odds will compensate for the chance that your needed cards are among the dead cards.

There are four cards that will score the full house: The two remaining Aces (there are four total in the deck, one is in your hand and one is already on the board), and the two remaining tens (ditto). Since four of the 46 possible remaining cards will win the hand on the river, our odds of winning the hand on the river are 4 out of 46 (8.7%).

Let's keep the whole implied odds concept simple and say that we get to act last and that, if we call the $8 and our river card hits, our opponent will just go ahead and make another $8 bet on the river, which we'll call. Let's also assume that, with the pot so big, the casino dealer has already pulled the maximum rake and jackpot drop, so no additional money will be taken from the pot.

With $46 in the pot plus another $8 from the opponent's bet, there's $54 total. Knowing this player will bet another $8 on the river if we hit, that's a total of $62 we will win if our hand hits. That's our expected positive outcome if we call: We will get $62.

If we call and the hand doesn't hit, we lose $8. We ignore all other money we've put into this pot: That's a sunk cost which you're not getting back whether you fold this hand or call and lose. Thus if we fold, we have a 100% chance of netting 0 dollars on that decision.

The expected value of calling is determined by the chance of hitting the full house and winning $62 minus the 91.3% chance of missing and our $8 call going to waste:

(0.087 * $62.00) + (0.913 * -$8.00) = -$1.91

If you hypothetically got into this exact same decision a million times, and you made the exact same decision to call every single time... over the long run you would average a loss of $1.91 for every time you called the bet. Thus the decision to call is not a profitable one: the expected value of calling is negative.

The decision to fold, even though its expected value is $0.00, is more profitable over the decision to call by $1.91. Yes, it's guaranteed you win nothing, but is a more relatively lucrative decision that the negative EV decision of calling. The times you hit and win money will not offset all the times you call and lose money.

Many experienced poker players make decisions involving expected value all the time, and (provided they have requisite skill and experience) over the long run win money because they don't invest in bets, calls and raises unless doing so has a positive expectation. As they get into these situations time and again, the positive EV decisions mean that they lose, but what they win when they invest offsets those losses and nets them a profit over the long run.

The reason I wasted your time with this long poker example is because expected value is a concept you can apply to everything in life.

... just as I decided to apply to Ballhype's Golden Picks contest. More to come in Part 3

Part 1: Ballhype's Golden Picks Contest and Expected Value

For the last few weeks I've played Ballhype's Golden Picks Contest. You basically try to predict winners and you received a weighted score for correct picks depending on which team other players picked. You get -1 point for every pick you make that loses. How many points you get for winning picks depends on how many other players picked the team that won and the team that lost. The winning players split a pool that consists of one point plus one point for every player that picked the wrong team. This offers a small reward for picking a favorite, while winning underdogs net far more points.

For example, let's say Florida plays Troy, and 9 players pick Florida to win while 1 player picks Troy to score the upset. If Florida wins like they're supposed to, the nine winning players evenly split a pool of two points: One point for the moron that picked Troy to win (that moron loses a point for picking wrong), and one bonus point for picking a winner. Two points divided by nine equals 0.22 points per player, so by picking Florida you get 0.22 points.

But let's say half of Florida's team gets eaten by Tremors-like underground burrowing alligators that for some reason find the taste of Troy Footballers unappealing, the game continues on despite the howling protests of Florida fans who weren't eaten before SWAT soliders were able to execute the offending alligators, and Troy manages to score a huge upset.

The one dude who picked the upset gets 9 points for every poor schlub that picked Florida, plus one bonus point for making the right pick. For successfully predicting the upset (or guessing), the winning player gets a total of 10 points.

Now, an astute player named Rich Hensley has exposed the folly of such a system: By predicting upsets in most games, Hensley scores so many points every time an underdog wins that it more than offsets all the times he loses a point when the favorite wins. Each week he is usually the winning player.

I hang around near the top each week thanks to keeping abreast of the Sagarin ratings, along with having taken to frequently mimicing Hensley's tactic. At the same time I notice his sub-.500 record with his picks and have wondered... if there a more optimal method to making picks that can maximize my score. Because otherwise, the best I can do is to just pick underdogs and essentially tie with Hensley for the top rating, and what's the fun in that.

Wednesday, November 25, 2009

NFL Starting Quarterbacks 1 to 32 for Week 12

Per the SAFR-heads at Football Outsiders, here are the current starting NFL QBs ranked first to last based on cumulative Defensive Adjusted Yards Above Average (check the FO link for more details on actual numbers and the methodology):

The list consists of current starting QBs. Injured first stringers are not included.

1. Tom Brady - Patriots
2. Peyton Manning - Colts
3. Matt Schaub - Texans
4. Brett Favre - Vikings
5. Kurt Warner - Cardinals
6. Drew Brees - Saints
7. Phillip Rivers - Chargers
8. Carson Palmer - Bengals
9. Tony Romo - Cowboys
10. Joe Flacco - Ravens
11. Eli Manning - Giants
12. Kyle Orton - Broncos
13. Matt Ryan - Falcons
14. Aaron Rodgers - Packers
15. Donovan McNabb - Eagles
16. Chad Henne - Dolphins
17. David Garrard - Jaguars
18. Vince Young - Titans
19. Jason Campbell - Redskins
20. Matt Hasselbeck - Seahawks
21. Alex Smith - 49ers
22. Marc Bulger - Rams
23. Bruce Gradkowski - Raiders
24. Jake Delhomme - Panthers
25. Jay Cutler - Bears
26. Josh Freeman - Bucs
27. Matthew Stafford - Lions
28. Ryan Fitzpatrick - Bills
29. Brady Quinn - Browns
30. Mark Sanchez - Jets
31. Matt Cassel - Chiefs
32. Dennis Dixon - Steelers

Saturday, November 21, 2009

NFL Quarterbacks 1 to 32 for Week 11

Here's what will likely become a weekly stat-drop feature.... Per the SAFR-heads at Football Outsiders, here are the current starting NFL QBs ranked first to last based on cumulative Defensive Adjusted Yards Above Average (check the FO link for more details on actual numbers and the methodology):

1. Tom Brady - Patriots
2. Peyton Manning - Colts
3. Matt Schaub - Texans
4. Kurt Warner - Cardinals
5. Brett Favre - Vikings
6. Drew Brees - Saints
7. Philip Rivers - Chargers
8. Carson Palmer - Bengals
9. Ben Roethlisberger - Steelers
10. Tony Romo - Cowboys
11. Kyle Orton - Broncos
12. Joe Flacco - Ravens
13. Matt Ryan - Falcons
14. Eli Manning - Giants
15. Aaron Rodgers - Packers
16. Donovan McNabb - Eagles
17. David Garrard - Jaguars
18. Chad Henne - Dolphins
19. Vince Young - Titans
20. Matt Hasselbeck - Seahawks
21. Jason Campbell - Redskins
22. Marc Bulger - Rams
23. Jay Cutler - Bears
24. Alex Smith - 49ers
25. Jake Delhomme - Panthers
26. Josh Freeman - Bucs
27. Mark Sanchez - Jets
28. Bruce Gradkowski - Raiders
29. Ryan Fitzpatrick - Bills
30. Matt Cassel - Chiefs
31. Matthew Stafford - Lions
32. Derek Anderson - Browns

NBA Draft Steals in History


The NBA has one of sports' shorter drafts, only two rounds long. This is due to the limited number of players required to field an NBA team, usually no more than 15. Despite this, few players beyond the mid to late 1st round make an impact in the NBA over their careers. Many never play a single minute in the NBA and many play hundreds of forgettable minutes, usually off the bench, before being dropped and forgotten. And this never minds the many top 10-20 picks that get drafted as franchise players but 'bust' as non-impact players.

How do so few NBA draftees make an impact? Until the rush of high school stars overran the NBA in the 1990's, it wasn't too uncommon for low draft picks to eventually become key contributors on NBA teams over their career. But as the influx of star teenage talent accelerated the league's natural increase in athletic talent, it became harder for anyone outside of top draft picks to break in, let alone make an impact.

Thus it's a surprise when a player picked late in the 1st round or anyone picked in the 2nd round goes on to become a star or key player. Such players often see no more than bench time or supporting roles. Many of the following steals in recent NBA draft history were late picks who ended up giving their teams more than they hoped for... though there is a notable top pick who was a great steal himself for entirely different reasons. Here are the top NBA steals of the post-modern basketball era, starting with the most recent:

Monta Ellis (Golden State Warriors, 40th overall 2006 draft)

The Warriors took a 2nd round flier on the talented Mississippi high school star guard who finished 2nd all time on the state's top career scoring list. After a quiet watch-and-learn rookie season on the bench, Ellis entered the starting lineup for the 2006-2007 season and averaged 16.5 points per game with over 4 assists and 34 minutes per game, never looking back. The Warriors' flier paid off, as Ellis is now the team's leading scorer and thief (2.3 steals) while leading a team known for distributing the basketball well with 5.4 assists per.

Carlos Boozer (Cleveland Cavaliers, 34th overall 2002 draft)

Despite a decorated college career as one of Duke's leading post players during 1999-2002, Boozer slid all the way to the 2nd round in a loaded 2002 draft (Yao Ming, Amare Stoudemire, Nene, Caron Butler and a host of heralded others who didn't quite pan out). The Cavs, having figured they already scored with Memphis guard Dajuan Wagner, had to feel as if they scored a bonus when Boozer fell to their 2nd pick.

The funny thing is that Wagner was a non-factor for the pre-LeBron Cavs in a forgettable three seasons, while Boozer became their impact player from the 2002 draft as their top big man before he turned his back on the Cavs to sign with the Utah Jazz in 2004. With the Jazz, he has since become one of the league's best post players, averaging no less than 18.0 points and 9.3 rebounds in any of his five plus seasons since. While the Cavs lost Boozer to free agency, he was still one of the 2002 draft's biggest scores.

Tony Parker (San Antonio Spurs, 28th pick 2001 draft)

The player picked two spots later in this draft, Gilbert Arenas (by the Warriors), would become a greater scorer. But few teams thought much of the teenage French point guard the Spurs happily swept up with the final pick in the 1st round. The Spurs are no strangers to luck with the draft, as you'll see later in this piece... and Parker ended up becoming the team's mainstay leader at point guard, remaining so to this day.

Michael Redd (Milwaukee Bucks, 43rd pick 2000 draft)

The typically woebegone Bucks didn't have much to crow about during the Aughts, but their leading scorer for years to come ended up coming from a forgettable 2nd round pick out of Ohio State University in the 2000 draft. After learning the ropes over his first three seasons, Redd vaulted past the 20.0 PPG mark in 2003-2004 and never looked back. He led the mostly forgettable Bucks in scoring for each of the next five seasons.

Manu Ginobli (San Antonio Spurs, 57th pick 1999 draft)

One year removed from a championship season, a talented Spurs team burned the 2nd to last pick in the 1999 NBA Draft on a lanky 21 year old Argentian wingman that could nail a long-range jumper, dish the rock like a 2nd point guard and take a charge with the sort of flair that draws phantom foul calls from unsuspecting referees. Like many foreign imports before him and since, Ginobli was taken more as a project than as an expected franchise-changer. But like Tony Parker after him, Ginobli's game translated better to the NBA than most could have imagined, and he has been a key player for one of the best teams of the NBA this past decade.

Tim Duncan (San Antonio Spurs, 1st pick 1997 draft)

Wait, you ask, how could the #1 pick in a draft be classified as a steal?

It's not the pick itself, an obvious one as Duncan was far and away the best player in the 1997 draft, but the circumstances that led to the Spurs acquiring their future franchise player.

The Spurs themselves were a fairly tough playoff team during the 1990's, led by star center David Robinson. Early in the 1996-1997 season, however, Robinson went down with a season ending broken foot. This with other injuries left the Spurs in shambles, and a normally competitive Spurs team stumbled to a league worst 20-62 record, which helped them win the NBA Draft Lottery and the 1st pick in the next draft.

This allowed the Spurs to add Wake Forest's Tim Duncan, giving the Spurs the leagues best post duo in the rehabilitated Robinson and the young Duncan. The #1 pick, usually reserved for giving one of the league's worst teams the draft's best talent, had by a twist of fate landed the best talent with one of the league's best teams.

The Spurs won their first NBA Championship the next season, and would go on to win three more NBA titles (2003, 2005, 2007) with Duncan as their centerpiece.

Nick Van Exel (Los Angeles Lakers, 37th pick 1993 draft)

The 3-point specialist out of a talented University of Cincinnati program didn't jump out at any draft scouts, but the Lakers were keen on Van Exel's shooting ability when their 37th pick came up and he remained on the board. Van Exel became the Lakers' starting point guard right away and he became a pivotal star for the post-Magic Lakers. He averaged 14-16 points per game and 7-9 assists during five Laker seasons, while nailing 1528 career threes and logging 76 career playoff games with three different teams over thirteen NBA seasons. Cincy coach Bob "Huggy Bear" Huggins taught him well.

Latrell Sprewell (Golden State Warriors, 25th pick 1992 draft)

Before he became known for choking out coach PJ Carlesimo at a practice, the one time rim-spinning basketball star was a talented but not quite heralded star from the University of Alabama, who jumped ship after a good but not great sophomore season at a so-so college program to go pro. As a result, his stock wasn't terribly high and he fell to the late 1st round, where the Warriors considered him an academic pick at 25. Before attempting to strangle his coach, Sprewell became one of the league's biggest scoring threats with an all around game of hyper speed power-dunks combined with an outside shooter's touch, leading a typically poor Warriors team in scoring from 1993-1994 until he choked out Carlesimo in December 1997.

The attack led to a season long suspension and an eventual trade to the Knicks. Violence and legal troubles hung over Sprewell for the rest of his productive but checkered career, but the Warriors still netted a huge score when he fell to him in the 1992 draft.

Wednesday, November 18, 2009

Why wasn't Elizabeth Lambert stopped the first time?


During a conference playoff women's soccer match between New Mexico and BYU, NMU player Elizabeth Lambert got herself on the national radar for all the wrong reasons:


Eventually, she issued what I'm sure was an apology hand crafted in part by New Mexico Athletics. She is suspended indefinitely and I would be surprised if she ever plays for them again.

My question isn't so much why she did it, as I'm sure she just lost her mind and once someone loses her mind there's no rationalizing a meltdown.

No, my question is how she was able to do it so many times. I've watched my fair share of soccer, and I find that the first time you so much as slide tackle someone a little too maliciously (let alone punch someone in the back, or dodgeball someone's head with a kicked ball, or hair-pull takedown somebody), you tend to get no less than a yellow card, and often you'll get red carded and sent off from the match.

Yes, it was a playoff match and going down 11 to 10 trailing 1 to nil would have essentially put a nail in New Mexico's coffin. But refs didn't let the competitive circumstances stop them from running French star Zinedine Zidane after he headbutted an Italian player in the 2006 World Cup Final. Refs in the NCAA Tournament don't let the do-or-die format stop them from calling a 5th and disqualifying foul on a team's star player. If you commit a foul, you commit a foul and it's an official's duty to call it accordingly.

You can argue that Elizabeth Lambert's actions are themselves inexcusable, but what's just as inexcusable is that the Mountain West soccer referees didn't immediately send her off the 1st time she committed a flagrant foul, let alone the 2nd, 3rd, 5th, 7th or umpteenth time. That they let her stay in the match and turn it into an informal one-sided catfight is a collective act of gross negligence on their part. Those officials ought to be punished themselves.

80-90% of those violations never happen if Elizabeth Lambert was sent off after the first flagrant act of violence on a BYU player. The best argument given for allowing the catfight style of 'play' to go is that said play is part of women's soccer. But honestly, I'm not sure how one can argue the hair pulling, malicious tackles and punches to the back are excusable at any level of soccer. The officials have to nip it in the bud, or you end up with spectacles like the one Elizabeth Lambert put forth in this match.

Sunday, November 15, 2009

Handicapping and the Sagarin ratings

As a Vegas native, with access to teeming masses of sportsbook data (as well as parents who regularly brought home parlay and teaser cards), I dabbled in speculative handicapping while growing up, studying teams and trying to predict games, with understandably middling results. Obviously, as a minor, I didn't wager any actual money, and once of-age I maybe placed bets on games a handful of times.

Anyway, I'm conducting a sizable experiment on handicapping games using Sagarin ratings. I crunched predictions for every NFL, NHL, NBA and college basketball game today, and I'm going to note the results relative to the predictions. In other words, I expect the results to deviate from the predictions... the questions is how much and in what direction, if a correlation shows up.

I had been toying with the Sagarin numbers for a while, in using them to toy with Yahoo's league ranker polling system and in making predictions for Ballhype's Golden Picks contest. When I haven't deviated from Sagarin's ratings, I find the picks straight up are accurate roughly 55-65% of the time.

Ballhype's system rewards fractions of points for picking successful favorites and several points for picking successful underdogs, while docking you one point for every incorrect pick period. This system is allegedly gamed very easily by consistently making an astute series of underdog picks: a couple of players win regularly at the game this way, though the reward is nothing more than being a featured user on Ballhype's front page.

But of course, handicapped picks must be made against the spread. Since Sagarin uses a unique scoring system somewhat irrelevant to the scoring in each respective sport, there may not be a direct correlation between the scoring difference using Sagarin's White Owl Predictor and the actual score of the actual game in question. It can show the scope of difference in performance ability between teams, but does it consistently match the likely difference in score?

Google research has turned up little data: As with most subjects, research posted on the subject is typically shallow and poorly thought out at best. On paper, I will pick each individual game against the spread using the adjusted Predictor scores relative to the point spread to determine my initial picks. I'll note the results and look to note any sustained differences between the predicted margin of victory and the results. I expect plenty of white noise and variance in the short term: The key will be to find long run correlations.

Picks below the jump. Warning: Lots of raw data, listed in a clunky straightforward format. Have some painkillers ready if you're going to read them all. I'll try and streamline the data into a spreadsheet or chart format as I go along.

Football coaching resources

Taking a little more than a passing interest in football strategy and analysis, I have stumbled upon the following resources:

Football Outsiders: Football's attempt at sabermetric-style analysis. The differences in variables between baseball and football pose a challenge to this approach, but FO offers an admirable effort to bridge the gap.

American Football Association: An organization devoted to the promotion of semi-pro and minor league football.

Gridiron Strategies: A site devoted to football coaching strategies.

Reference as you please.

Saturday, November 7, 2009

If you won't punish one star for using drugs, then why punish the other?

Tim Lincecum got rung up for speeding on I-5 near Vancouver, WA and got caught with pot in his car, a charge that has since legally been settled. As for whether the Giants ought to punish him... if they're not going to punish their biggest star ever for using performance enhancing drugs, then why should they punish their star pitcher for smoking a bowl in the car en route to WA?