I went to Google and searched for data on Sagarin and Probability. Many articles had a narrow focus, whether on their respective team or on yet another failed (and poorly researched) attempt to beat the sportsbooks with the data without any preliminary research. My previous observations showed that the final scores in any sport deviated so greatly from the point differential in Sagarin ratings that using them to determine a margin of victory was practically pointless as they were... though they still remained an accurate determinant of which team would win.
I landed on some data relating to Sagarin's ELO Chess number (which simply judges team resume strength by who they won and loss to with no regard to final scores)... that illustrated how you can use a chess player's rating in a 1500 point system to determine the probability of one player beating the other. The article by Brian Burke illustrates how a chess rating is determined on a match to match basis, and the workings of the algorithm that determines win probability for each player before a given match. The formulas may make your head explode unless you've seen Trig, Intermediate Algebra or Calculus level math before.
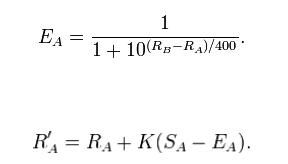
The rating formula, however, does a fine job of weighing the quality of a victory and using outcomes to determine a player or team's actual strength from their track record. And the probability formula provides an accurate correlative probability for each player's chances of victory.
Burke wrote that article in the context of evaluating the Sagarin rating system, and since Sagarin himself based the method off of the chess rating system, it would stand to reason that his ratings could in turn be used similarly to determine a team's probability of winning. Of course, using the formulas directly would not work since ELO Chess uses a 1500 point rating scale, and Sagarin's rating scale (where most ratings are around the 50-100 point mark) is distinctively different.
A similar rendition of the probability equation is shown here on the Pro Football Reference blog, where instead of the static factors of 10 and 400, factors of e (2.718281828...) and a different equation utilizing the control factor of -0.15:
Win Probability = 1 / (1 + e^(-.15*(rating difference)))
This formula always returns a value between 0 and 1, which can be translated into a percentage chance of victory.
Armed with OpenOffice Spreadsheet Power, I opened up a spreadsheet and tinkered my way to a template on which I could enter two competing teams' Sagarin ratings (with the requisite rating adjustment for the home team) and have a function spit out the home team's chance for victory:
=1/(1+(e^(-0.15*((home team's rating + home team bonus)-road team's rating))))
Convoluted? Basically, the difference between the home team (with their bonus) and the road team is multiplied by -0.15. Then the factor e (2.718281828...) is taken to the power of whatever number the first equation adds up to. That answer is added to 1, and then 1 divided by the answer to the last equation is the home team's chance of winning.
Because I enjoy crunching all this by hand as much as you do, I opened up an OpenOffice spreadsheet and plugged the formula into a simplistic interface that would allow me to just plug in Sagarin Predictor ratings (which Sagarin vouches is the most effective of his three given ratings in predicting outcomes, as they factor in final scores) and get a quick probability for the home team.
With no other specific data out there to verify or deny using the formula this way with Sagarin ratings, I plugged in a few Sagarin ratings for upcoming matchups, and the results I got were fairly consistent. To wit, top 25 teams often sported 95-98% chances of beating small college scrubs. If there's any data out there that provides a more accurate method for matching Sagarin ratings to probability, I have yet to find it.

Cell B3 contains the home team bonus (which varies by sport). Cell A2 holds the visiting team's rating and B2 the home team's. I plugged the formula in at cell B1, which spits out a probability for the home team.
Above are ratings for two teams whose identities I have since forgotten (though from the 3.98 home bonus I recognize the teams are from NCAA College Basketball). The road team's 88.30 rating and home team's 87.63 rating with 3.98 bonus indicates that the home team has a 62.2% chance of winning their game, which makes sense: In a basketball matchup between two roughly equal teams (which these two are), the home team tends to win 60-65% of the time.
(One aside: A common misinformed complaint about Sagarin's Predictor rating is that a huge blowout can artifically inflate a team's rating. However, the rating process actually follows a law of diminishing returns: For example, in determining the Predictor rating, a 35-0 victory adds more to a team's rating than a 14-10 victory... but a 70-0 victory doesn't add all that much more than a 35-0 victory. Both blowouts add roughly the same amount in rating strength.
Likewise, in determining win probability... the greater the difference in ratings, the greater the probability the favorite will win... but as the difference increases in size, the amount of winning probability added to the favorite's chances reduces in scope. The PFR article includes a helpful graph to illustrate:
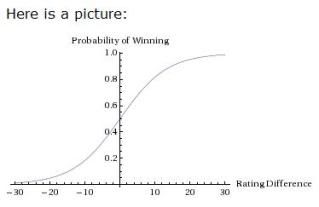
Much like a bell curve, the chances of winning change dramatically as the difference between teams goes up from 0... but as the difference reaches a high margin, the chances of the favorite winning flatten out around the 95-98% mark, which makes sense since, after all, you can't go past 100% and if any team really had a 100% chance of winning, there'd never be any Appalachian State over Michigan level upsets and there'd be no point in playing the game.
Now... going back to Ballhype's Golden Picks Contest, the value of a pick is directly proportional to how many other people have picked each particular team to win. The more people that pick one team, the fewer points each person gets when the favorite wins, which diminishes the value of picking the favorite as each additional person selects that favorite to win.
Lisewise, the more people that pick a favorite, the more value there is in picking the underdog, as you'll then get more points if the underdog wins. At the same time, the more people that pick the underdog, the less value you get in picking the underdog, as each additional person dilutes the split each person gets for a successful underdog pick... and in turn, the more value that subsequently comes in picking the favorite, since those who pick the winning team get an additional point for each person that selects an unsuccessful underdog.
Amidst all this, there is one constant: Every incorrect pick is always worth -1 point, regardless of whether your incorrect pick was a favorite or underdog. That's where the Hensley Strategy succeeds: There is a stop-loss limit of -1 point for every wrong pick, but no ceiling on the point value of successful underdog picks. With every additional person picking the favorite, you get an additional point if you're picking the underdog and the upset happens. With a shallow ceiling for failure and a ceilingless potential with success, picking underdogs typically carries a positive EV.
The thing is, picking an underdog does not always produce a positive EV. There is a point where a favorite is such a huge favorite that a large number of people would need to pick the favorite for an underdog pick to have a positive EV.
The point of all this is that I expanded my meager spreadsheet with a pair of separate EV functions that factored in the calculated probabilities of each team, the number of picks for each team on the contest, and the expected value of each respective pick:
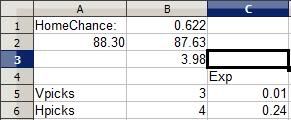
In Cell B5 I enter the number of current picks in the contest for the visitor and picks for the home team in Cell B6. Column C6 determines the EV of picking the home team with the following formula:
=(Home team probability *(Number of total points for correct pick divided by number of players making this pick)+((Road team's win probability)*(-1 point for losing)))
Basically, I take the probability of a win times the possible points I can earn for winning, then add together the probability of losing (the other team winning) times -1 point. The formula is flipped over for the road team, and the expected value of each respective pick is listed under "Exp" for both picks. Currently, the 3 people who picked the road team have an expected value of 0.01 point... barely above zero and just a shred more valuable than not having made the pick at all. The 4 people who selected the home team have an EV of 0.24 point, meaning the pick has a positive expected value, a smart pick....
... for now. See, other people may make a pick between now and game time, and every pick can affect the expected value of a pick, even though the probabilities aren't going to change, since every pick affects the potential point distribution for the winner.
Let's see what happens when I decide to pick the road team.
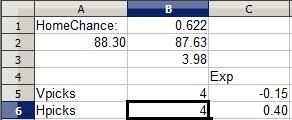
The EV for picking the road team immediately drops to -0.15 points, making it a bad pick in the same sense that playing craps is a negative EV decision. In craps, the odds make it so that the House will take your money in the long run. If I were put in this same situation an infinite number of times and made this exact same pick, I would lose an average of 0.15 points for each time I made the pick. It's a losing pick: The points I win every time the road team succeeds are not worth as much as the point I lose every time the home team wins. Sure, the road team may win and it's all moot, but the combination of the odds and the potential value show that this is a bad pick.
Now, let's see what happens when I flip flop and pick the home team instead.
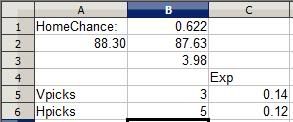
The value of picking the home team also decreases (a pick's EV is always going to decrease when you make it because you're diluting the payout by adding a person to divide it with). But in declining, the EV of the selection remains positive. If placed in this situation an infinite number of times, I would gain an average of 0.12 points for each time I picked: The value of a win here is going to be worth more than all the times I lose a point when the pick fails.
Thus, it's clear in this instance that I ought to pick the home team to win. Sure, in this case I'm picking the favorite, but it's not always worthwhile to pick the favorite. Here's an example where picking an underdog may be a good decision:
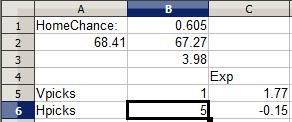
This college basketball matchup I remember: Pepperdine traveled to Wyoming for a non-conference game. Both teams are fairly so-so but roughly equal, making the home team Wyoming a 60.5% favorite. However, as you can see five other players had already selected Wyoming while only one had selected Pepperdine, making the Wyoming selection a negative EV pick for everyone involved while the Pepperdine pick was an overwhelmingly positive EV pick. So I went ahead and picked the underdog Pepperdine:
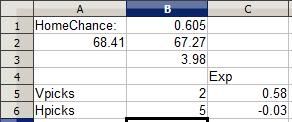
As you can see, the reduced EV was still overwhelmingly positive, making the Pepperdine pick a more profitable pick. Even if Pepperdine goes on to lose as predicted, the value the Wyoming selectors got from their pick was negative. Results based analysis would say they're right, but probability analysis shows that making that pick 1000 times would be a loser in the long run. A somewhat-unlikely Pepperdine upset would yield more value for Pepperdine selectors than a likely Wyoming win would net for Wyoming selectors.
Now, this doesn't necessarily mean picking a favorite in Ballhype is a bad value, or that picking a big underdog is necessarily a good value. Sometimes a team is such a large favorite that even if their win would net a selector a very small score and that an upset would net an underdog pick a huge score... the odds are so great that the favorite will win that picking the underdog is pointless.
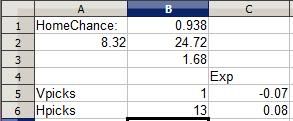
This is from this week's NFL matchup between the Cleveland Browns and Cincinnati Bengals in Cincinnati. The Browns' rating is clearly horrid in comparison to Cincinnati's and the Bengals are a huge 93.8% favorite. Even with a whopping 13 other selectors diluting the Bengals pick, the Bengals remain a positive (albeit small) EV pick while the Browns remain a negative pick, simply because the odds of the talented Bengals defeating the woeful Browns is so great. I add my pick to the fray:
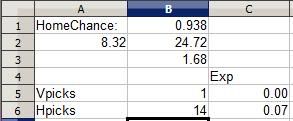
Notice how the EV remains positive for the Bengals pick. A Bengals win nets 0.14 point, but the chance of earning that point is so great and the chances of a crushing -1 point upset are so small that the Bengals pick is still a smart one, while picking the Browns is foolish despite the 14 point potential, akin to putting your money on a couple of roulette numbers (a more than 35 to 1 shot for each number) and hoping one happens to hit. (The Bengals did go on to win this early game 16-7)
It is with this methodology that I went to work on picking Friday's games... to be covered in Part 5.

No comments:
Post a Comment